How Much Is the Average PTO in the US?
September 26, 2023

Did you know small business employees value their paid time off (PTO) almost as much as they value healthcare coverage?
In a recent report of more than 600 small business employees, PTO outranked dental coverage, vision coverage and 401(k) plans as Americans’ favorite benefit. It rated second only to employer-sponsored healthcare coverage.
As a small business owner, it may be critical to your business to have a documented and competitive PTO plan. But what makes a PTO plan competitive in small business these days? The short, dry answer is anything above average. Therefore, giving serious consideration to the average PTO in U.S.A. job markets can help you attract future job candidates and maintain current employees, especially as the markets tighten.
Then the question becomes what’s average? How much paid time off is normal?
Ten days is the average number of PTO for private sector employees who have completed one year of service, according to the Bureau of Labor Statistics (BLS).
This number, rounded to the nearest whole number (it’s actually 9.7 days), does not include sick days or paid holidays. But it turns out the average PTO length varies substantially depending on a number of factors, like tenure with a company, public vs. private industries and your geographic location.
Here, we look at average days of PTO across various metrics, based on data compiled from the BLS as well as our own survey data. We hope this helps you stay above the curve, literally, when it comes to positioning your competitive PTO policy, or at minimum give you some guidance about what the average PTO looks like in other companies, industries, and geographies around you.

A company that is considered a great place to work can attract a larger pool of quality candidates. Get our eGuide, Six Ways to Attract Top Talent: How to Become an Employer of Choice.
Beyond the standard annual average PTO accrual rate, your average vacation days per year may increase over time. The average American small business employee can expect to earn an extra three to four days of PTO every five years of service to an employer, according to the BLS. This data, stemming from a representative sample of U.S. workers, confirms what we all likely already knew: Vacation days increase over time. But to what extent? How much vacation time is normal to rack up this way? According to the feds, by the time you’ve worked 10 years at the same employer, you’ve put three to four weeks’ paid vacation in your pocket.
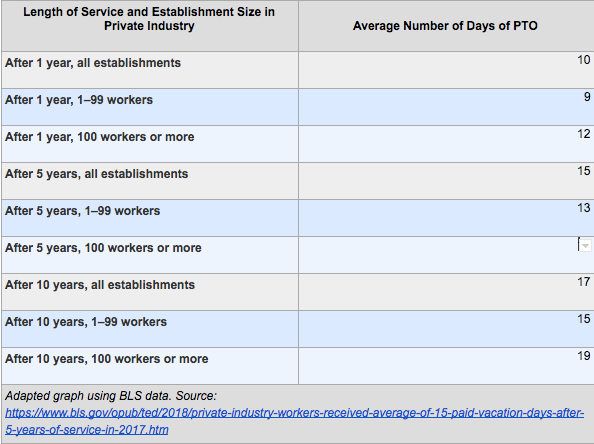
Length of Service and Establishment Size in Private Industry Average Number of Days of PTO
After 1 year, all establishments 10
After 1 year, 1–99 workers 9
After 1 year, 100 workers or more 12
After 5 years, all establishments 15
After 5 years, 1–99 workers 13
After 5 years, 100 workers or more 16
After 10 years, all establishments 17
After 10 years, 1–99 workers 15
After 10 years, 100 workers or more 19
Adapted graph using BLS data. Source.
How much PTO do you get in your field these days? There are 32 industries listed below, with PTO data averaged from only 606 small business employees from our survey. It doesn’t take a data scientist to know, because of the diffusion of the data across many buckets, the sample size is not likely to provide statistical significance for each industry. We’ve got more work to do munging and crunching public data sources to pull in a more representative sample on this question. Still, we thought this “starter data” was worth sharing to help you gauge how much PTO is normal, so to speak. Just, please, take these numbers with a small grain of salt.
Average Number of PTO Days by Industry
Perspective is everything. When you’re talking to new candidates during the hiring process, be cognizant of the extent to which geographic perspective might influence what your candidate imagines PTO looking like. According to our findings, Northeasterners might assume a more generous PTO allowance compared to their Southeastern neighbors.
Average PTO Days by Region
West:
Southwest:
Midwest:
Northeast:
Southeast:
Employees earn longer stints of PTO over time and often carry earned PTO allowances with them from employer to employer. If you’re hiring new employees, make sure your HR team is sensitive to more seasoned workers who likely expect more liberal vacation policies compared to younger hires.
Inasmuch, it’s not surprising people aged 55 and older feel disproportionately more satisfied with their PTO plan (67%) compared to their 18-24-year-old counterparts (50%).
Average Number of PTO Days by Age
We hope these averages helped you contextualize your business and its policies. When you’re ready to get pen to paper and start drafting or revamping your PTO policy, consider filing it into an HR resource that your employees can access with ease and familiarity.
An employee handbook is a great start. A digital employee handbook is “next-generation.”
If you need help, talk with one of our HR consultants. TriNet offers on-call HR support that can help guide your HR questions and decisions, including the tough stuff like U.S. state regulations for sick days.
This communication is for informational purposes only, is not legal, tax or accounting advice, and is not an offer to sell, buy or procure insurance.
This article may contain hyperlinks to websites operated by parties other than TriNet. Such hyperlinks are provided for reference only. TriNet does not control such web sites and is not responsible for their content. Inclusion of such hyperlinks on TriNet.com does not necessarily imply any endorsement of the material on such websites or association with their operators.